e-Stat 2015年国勢調査 小地域から長野県を抽出
ソースコードと解説
実行した環境は Google Colaboratory です。
system("apt-get install -y fonts-noto-cjk")
日本語フォントをインストールします。
インストール後、「ランタイム」-「ランタイムを再起動」を行わないと有効にならないっぽいです。
library(tidyverse)
theme_update(text=element_text(family="Noto Sans Mono CJK JP"))
ggplot2 等のライブラリの読み込み。
ggplot2 で使うデフォルトのフォントを Noto Sans Japanese に設定。
# トップページ  地図で見る統計(統計GIS)  境界データダウンロード
#  小地域   /  国勢調査   /  2015年   /  小地域(町丁・字等別)(JGD2000)   /  世界測地系緯度経度・Shapefile   /  長野県
#  20000 長野県全域 2018-05-14
system('curl -o A002005212015DDSWC20.zip -JLO "https://www.e-stat.go.jp/gis/statmap-search/data?dlserveyId=A002005212015&code=20&coordSys=1&format=shape&downloadType=5&datum=2000"')
system("unzip A002005212015DDSWC20.zip")
e-Stat(日本の統計が閲覧できる政府統計ポータルサイト)からデータをダウンロードして解凍します。
前回は Google Drive を使いましたが、今回は直接ダウンロードしてみました。
curl の -o でファイル名を指定しているのは、-JLO で実行しても URL の名前になってしまった為です。
レスポンスヘッダーの Content-Disposition には
「attachment; filename*=UTF-8’‘A002005212015DDSWC20.zip」
とあるんですけどね。
# https://github.com/r-spatial/sf/issues/1572#issuecomment-758858154
system('sudo add-apt-repository ppa:ubuntugis/ubuntugis-unstable')
system('sudo apt-get update')
system('sudo apt-get install libudunits2-dev libgdal-dev libgeos-dev libproj-dev')
install.packages('sf')
library(sf)
sf パッケージをインストールして読み込みます。少し時間が掛かります。
nagano_pref <- read_sf("/content/h27ka20.shp")
ggplot(nagano_pref) + geom_sf()
Shapefile を読み込んで、どんな図なのか見てみます。
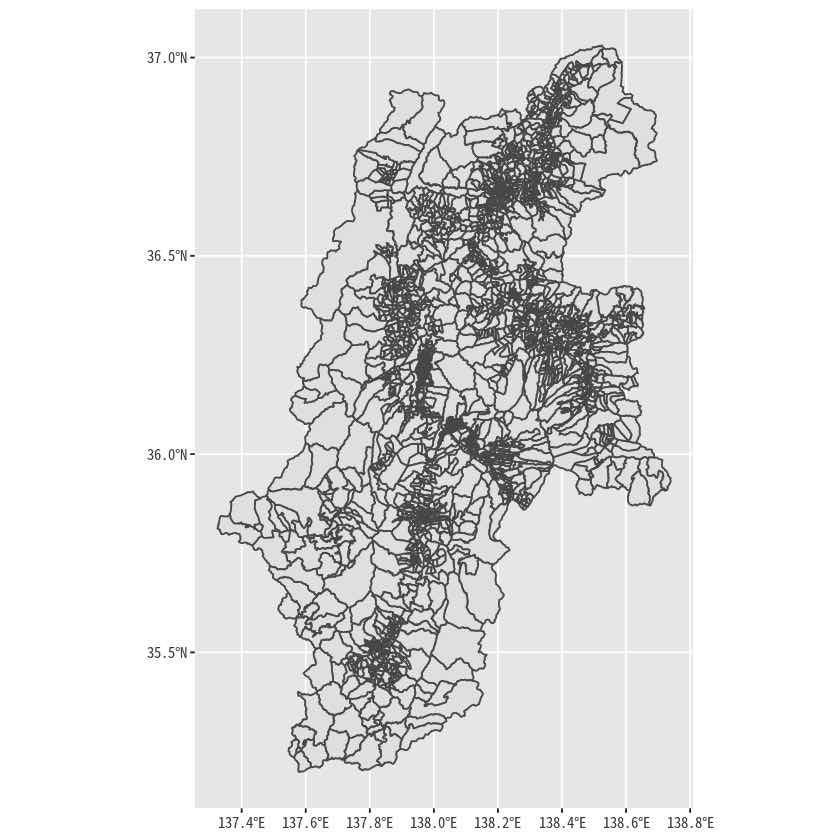
はい。長野県ですね。
ggplot(nagano_pref) + geom_sf(aes(fill = JINKO))
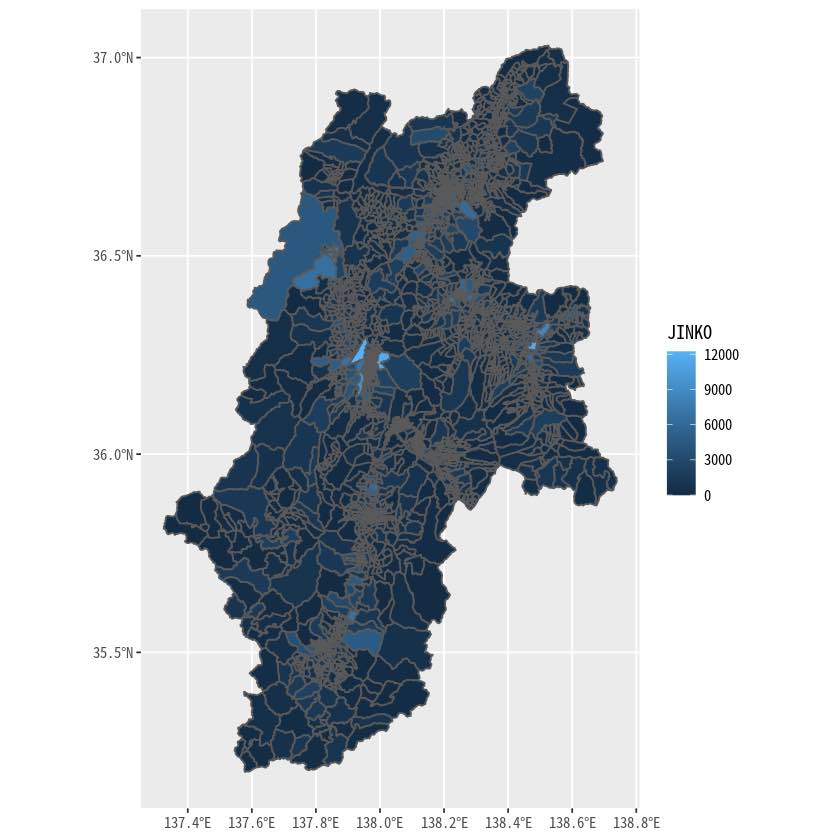
人口もありますね。もう少し加工してみます。
ggplot(nagano_pref) +
  geom_sf(aes(fill = JINKO)) +
  geom_sf_label(aes(label = S_NAME)) +
  scale_fill_gradient(low = "#ffeeee", high = "#ff6e6e") +
  labs(x = "経度", y = "緯度", fill = "人口") +
  theme_minimal()
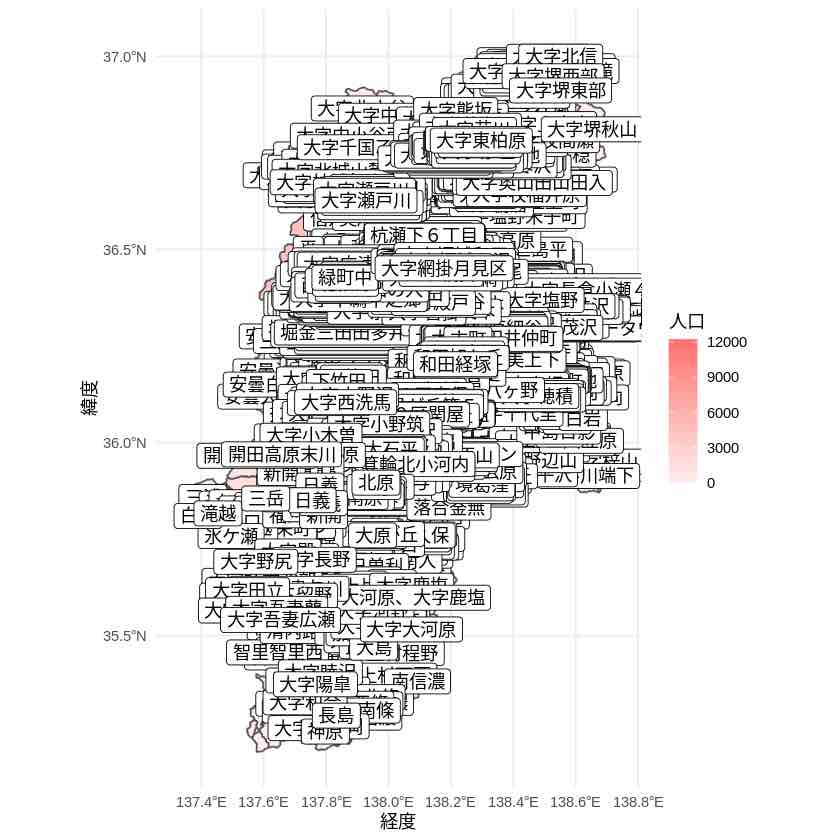
町丁・字等の表示は無謀でした。
市町村ぐらいにしてみます。
sf::sf_use_s2(FALSE)
nagano_pref2 <- nagano_pref %>%
  dplyr::group_by(CITY_NAME) %>%
  dplyr::summarise(JINKO = sum(JINKO), .groups = "drop")

nagano_pref2$CITY_NAME <- as.factor(nagano_pref2$CITY_NAME)
sf::sf_use_s2(FALSE) は、エラー「Error in s2_geography_from_wkb(x, oriented = oriented, check = check): Evaluation error: Found 2 features with invalid spherical geometry.」を回避する為に指定しています。
ggplot(data = nagano_pref2) +
  geom_sf(aes(fill = JINKO)) +
  geom_sf_label(aes(label = CITY_NAME)) +
  scale_fill_gradient(low = "#ffeeee", high = "#ff6e6e") +
  labs(x = "経度", y = "緯度", fill = '人口') +
  theme_minimal()
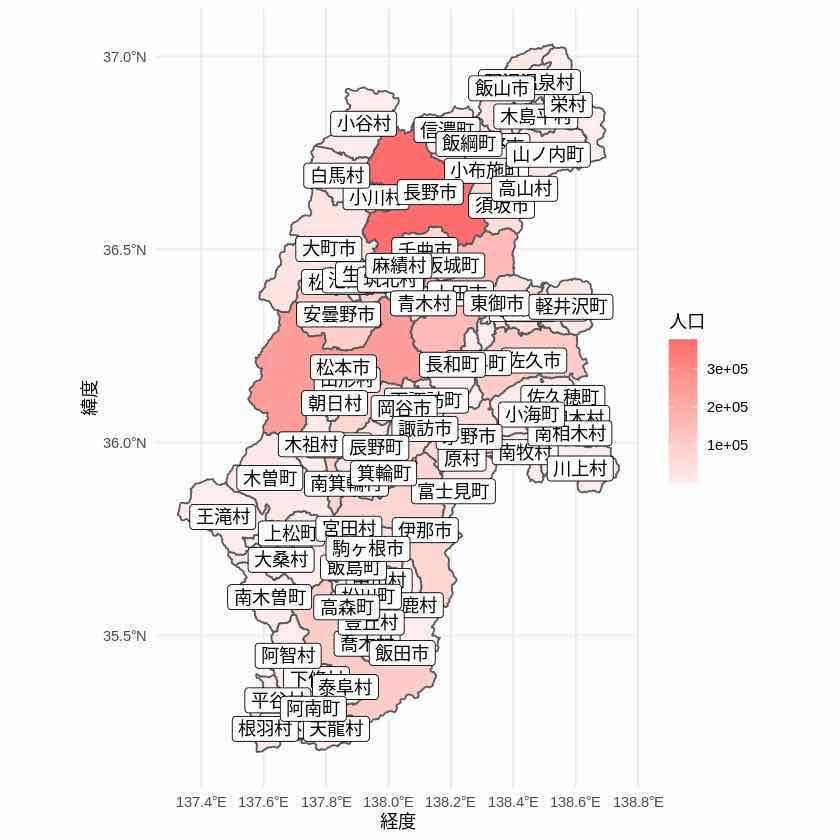
名称は市町村ぐらいが良さそうです。
ggplot() +
  geom_sf(data = nagano_pref, aes(fill = JINKO)) +
  scale_fill_gradient(low = "#ffeeee", high = "#ff6e6e") +
  geom_sf(data = nagano_pref2, alpha = 0) +
  geom_sf_label(data = nagano_pref2, aes(label = CITY_NAME)) +
  labs(x = "経度", y = "緯度", fill = '人口') +
  theme_minimal()
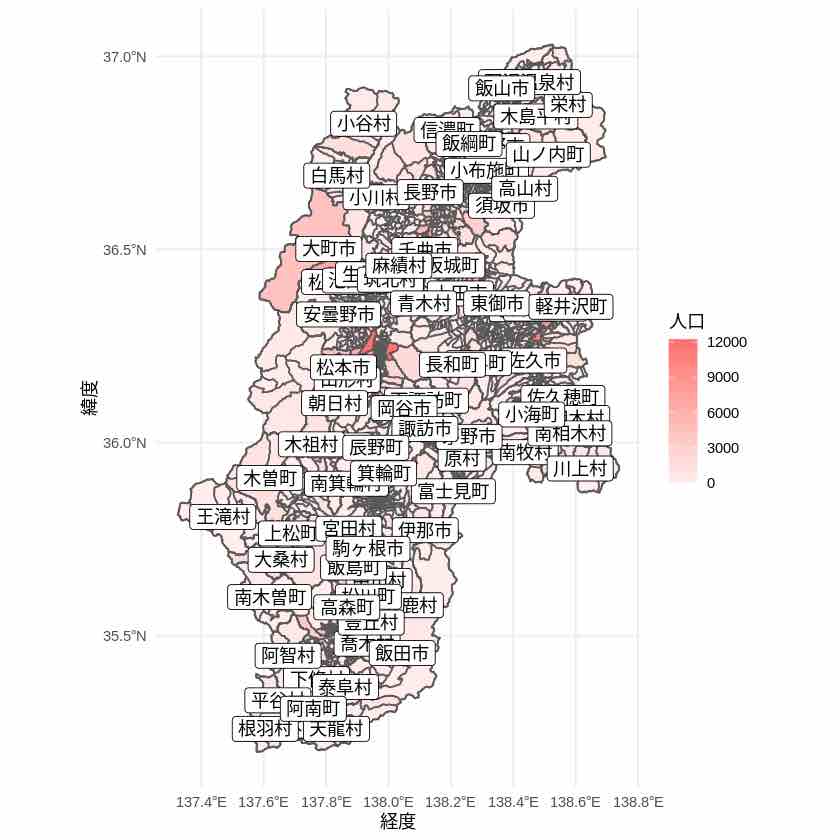
町丁・字等の人口の上に、市町村の名前を乗せてみました。
良さそうなので、色々微調整してみます。
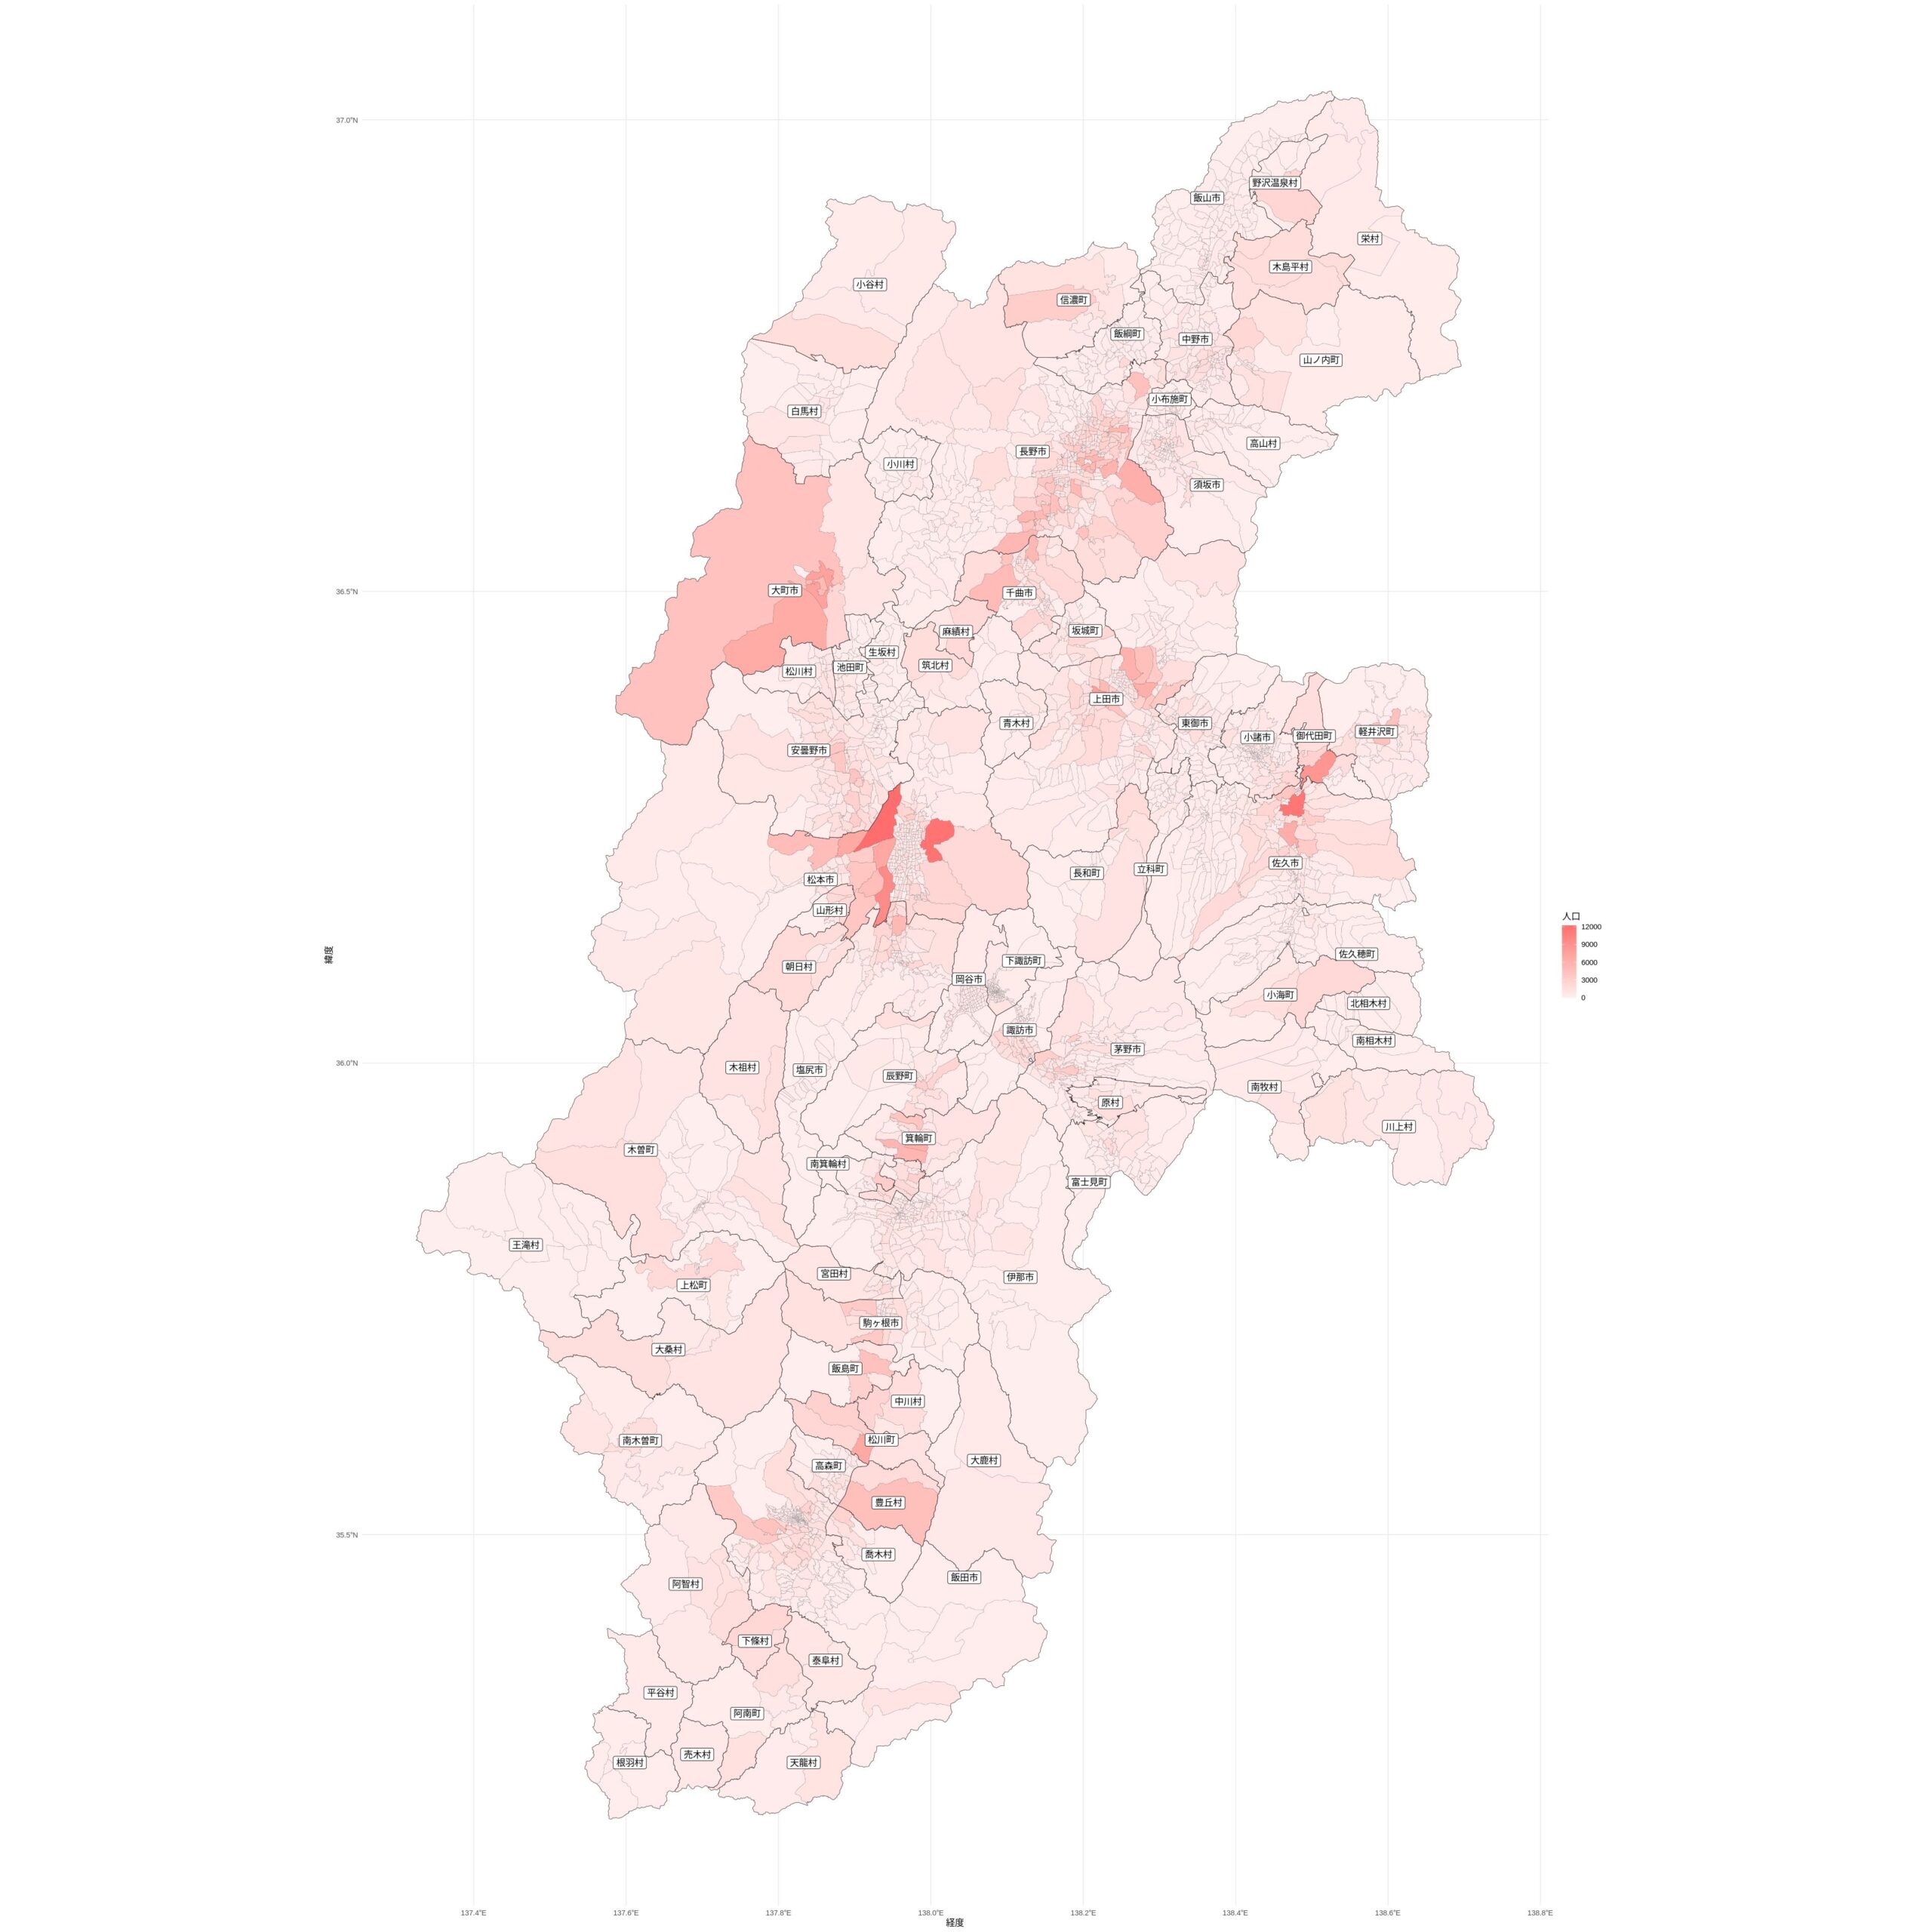
以下で、本投稿にある最初のマップになります。
options(repr.plot.width = 32, repr.plot.height = 32)
ggplot() +
  geom_sf(data = nagano_pref, aes(fill = JINKO), size = 0.07) +
  scale_fill_gradient(low = "#ffeeee", high = "#ff6e6e") +
  geom_sf(data = nagano_pref2, alpha = 0, color = "#333333", size = 0.2) +
  geom_sf_label(data = nagano_pref2, aes(label = CITY_NAME)) +
  labs(x = "経度", y = "緯度", fill = '人口') +
  theme_minimal()